ADDENDUM
The circles in Figure A-1 indicate the change in Amazon ebook sales rank with the sale of a single ebook during the first seven months of 2013, superimposed on Figure 14 of the original analysis of paper books. For values of sales rank before the sale above 500,000, the after sale values in 2013 were similar to those of 2009 for paper books. But as the before sales rank values decreased from 500,000 to 100,000, the 2013 ebook after sales rank values shifted away from the 2009 paper book values, indicating that selling an ebook didn’t decrease the sales rank as much as selling a paper book.

Figure A-1.
Figure A-2 shows the 2013 ebook values (circles) superimposed on Figure 15 of the original analysis paper book values. The difference between the ebook and paper book values is dramatic. The solid curve suggesting the average of the 2009 paper book values indicates that the sale of a single book would reduce a 100,000 Amazon sales rank to a little less than 40,000. The 2013 ebook values indicate a single sale would reduce the sales rank from 100,000 to about 57,000. A second sale would then reduce the 57,000 value to about 44,000. Two sales starting from 100,000 in 2013 for an ebook would not reduce the sales rank as much as a single sale of a paper book in 2009.

Figure A-2.
Sales records of Kindle Direct Publishing (KDP) ebooks are available to the authors at the kdp.amazon.com website. The large red dots in Figures A-3 and A-4, spaced at 24-hour intervals, indicate daily sales of an ebook. The small black dots show the hourly Amazon sales rank values for day 17 (January 17) through day 111 (April 21) of 2013. The black curve is the result of a 23-hour smoothing of the hourly sales rank values.

Figure A-3.
Figures 17 and 18 of the original paper book analysis indicated that the time of day sales occur affected the average sales rank. To know whether the corresponding change in Amazon sales rank occurs before, after, or at the same time that a book sale is indicated at the KDP website, you would have to monitor the website every hour and record the results throughout the day. Unfortunately, no such service is available, such as the one rankforest.com provides for Amazon sales ranks. Instead of positioning the daily sales values in Figures A-3 and A-4 at mid-day, they were shifted subjectively for best alignment with the black curve indicating the Amazon sales rank variation averaged over 23-hours.

Figure A-4.
The positions of the circles in Figure A-5 for sales ranks larger than 10,000 were derived subjectively from Figures A-3 and A-4. For example, for seven days surrounding day 88 the daily sales were 0, 1, 0, 1, 0, 1, 0. Even though the sales rank fluctuated wildly during that interval, the curve suggested an average sales rank value of 156,000 for 0.5 books per day. Both 100,000 and 200,000 would obviously be inappropriate. At the other extreme of the sales shown, 10 books were sold the day before 12 books were sold on day 25, so the 12-book average sales rank of 13,900 should have been reasonable and not adversely affected as it would have been if there had been either very large of very small sales on the previous day.

Figure A-5.
The values of circles for sales ranks less than 10,000 in Figure A-5 were for January 2012 sales of the ebook Not What She Seems by Victorine E. Lieske and some July through August 2012 ebook sales by Phoenix Sullivan (http://www.kboards.com/index.php/topic,127009.0.html).
The solid curve in Figure A-5 shows the paper book relationship from the fonerbooks.com/surfing.htm website that was used in Figures 11 and 18 of the original analysis. The circles indicate that the situation was not too much different in 2013 for ebook sales ranks in the 40,000 to 100,000 range. But the data indicate that significantly more ebooks need to be sold in to achieve lower sales ranks. The fonerbooks.com curve indicates that a sales rank of 20 could be attained by selling about 200 paper books per day. The dashed straight line, subjectively fitted through the data, indicates it would require selling about 2,000 ebooks per day in 2013 to achieve a sales rank of 20. The dashed line is a power law whose mathematical expression is
sales rank = 200,000 / (sales per day)^1.2
where ^1.2 says that the number of ebooks sold per day is raised to the 1.2 power. Basically, what it means is that if your sales rank is below 100,000 and you want to decrease it by a factor of 10, you need to sell about 7 times as many ebooks each day.
A significant change since 2009 is the decrease in how often Amazon actually updates its sales ranks. Nominally they are updated every hour. Figure 4 of the original analysis showed that the sales ranks generally updated each hour, but several times a day they would freeze for an hour or two before jumping to catch up with the general trend. Of the 53 values shown in Figure 4, 13 of them (or 25%) were frozen. It was speculated that some glitch interrupted the computation for a given hour but did not distort the values at later times.
Figure A-6 shows the situation in 2013 for five books of various sales ranks ranging from almost a million to less than a thousand. The circles indicate the Amazon sales rank values. If a sales rank is identical to the previous sales rank (frozen), it is connected to it by a straight line. The dashed vertical lines contain 25 values for each book, from midnight on July 19 to midnight on July 20. From top to bottom within those five sets of 25 sales rank values, the number of frozen values was very consistent: 10, 11, 9, 11, and 9. Of the 125 values, 50 of them (or 40%) were frozen.
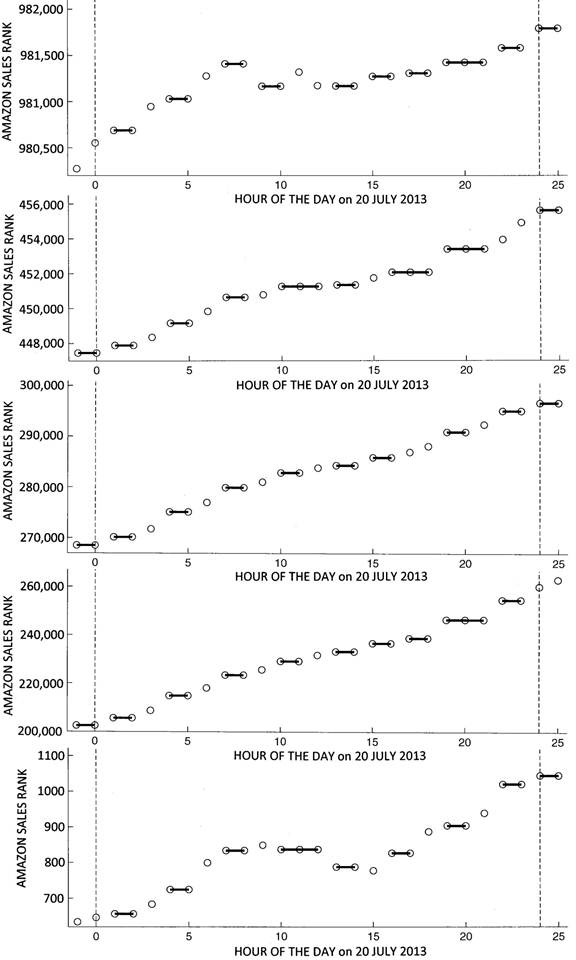
Figure A-6.
It appears that the volume of sales is such that the Amazon computer system assigning sales rank values is having a more difficult time trying to get all the computations done.